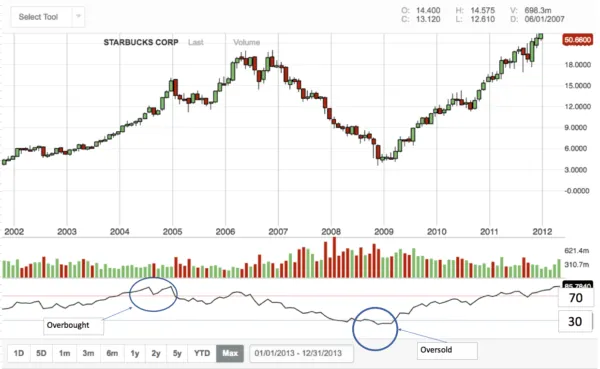
The Relative Strength Index (RSI) is a momentum oscillator that is widely used which measure the change and speed of the price movements. It was developed by mechanical engineer J. Welles Wilder. The RSI index oscillated between 0 and 100. Fundamentally the RSI is considered overbought when above 70 and oversold when below 30. RSI usually is also used to identify trend patterns.
How does the RSI indicator works?
The value of the RSI index is calculated over a 14 day period which fluctuates between 0 and 100. Fundamentally, the RSI index signals overbought when the indicator is above 70 and oversold when it is below 30. The levels of the security can be adjusted according to the best fit for assets if a specific trader is watching. For example, if the RSI hits consistently below 30 you may want it to change to 20 to get more reliable trading signals.
Important note: During strong trends, the RSI may continue to rise or fall after an oscillator indicates overbought or oversold conditions in the market.
The RSI frequently forms a chart sample that is usually not shown on the underlying price chart like the trend lines, double tops, and bottoms, etc.
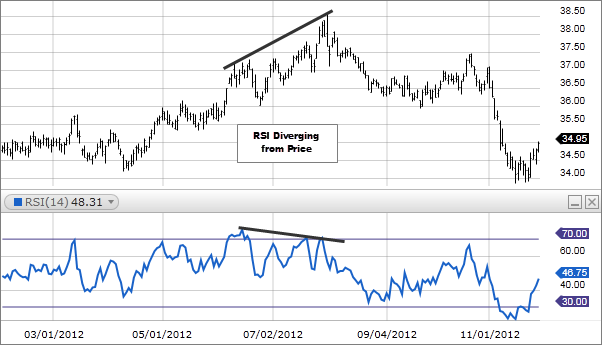
The RSI Indicator is a divergence Indicator
Bullish and Bearish markets play a pivotal role in RSI indicators. Usually, in an uptrend or bullish market, the RSI values normally range between 40-90 in which the range between 40-50 acts as a support. Similarly, during a downtrend, the RSI values sit between 10-60 in which the 50-60 range acts as a resistance. These diverging results occur when the price of the security and RSI value vary. Like when the security price is increasing but the RSI is falling it indicates divergence and vice versa. This is a strong recommendation for an imminent market correction.
Support and Resistance Pattern of the RSI
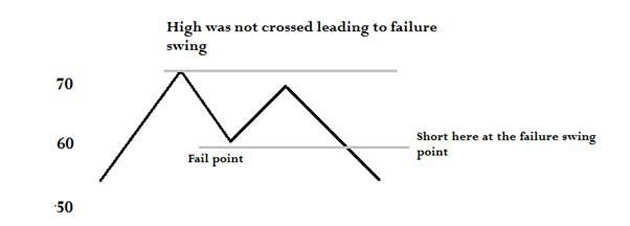
The RSI exhibits support and resistance levels that are more transparent than the security prices themselves. RSI shows the 14-day stock prices of securities which is overbought level are set at 70 and the oversold level is set at 30. But, there usually are support and resistance level penetrations or breakouts which are called failure swings. They are signs of impending market reversals.
For example, In the chart below the RSI indicator touches the 70 mark which is the threshold of overbought, and then falls to 60. This is called the fail point. It then again rises but does not reach the previous high mark thereby creating a failure swing. Post that, it falls below the fail point creating a bearish failure swing. This indicates the trader to go for a short position on their security.
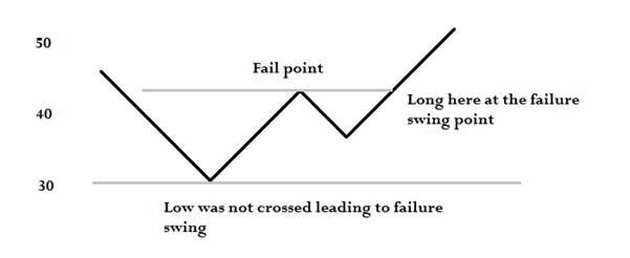
Following this, in the chart below The RSI indicator touches the 30 mark which is the threshold of the oversold zone, and then rises to 40 which is the fail point. It then falls again but the fall exceeds the previous fall of 30. Post that, the RSI exceeds the fail point rising higher than the previous rise creating a bullish failure swing. It indicates the trader to go for a long position in the security.
These are the inferences that can be derived from the Relative Strength Index.
Calculating the Relative Strength Index(RSI)
The RSI is a pretty direct and simple formula but is difficult to understand without highly complex and technical explanations. The simple formula is;
RSI = 100 – [100 / (1 + (Average of Upward Price Change / Average of Downward Price Change)]